Multiple Choice
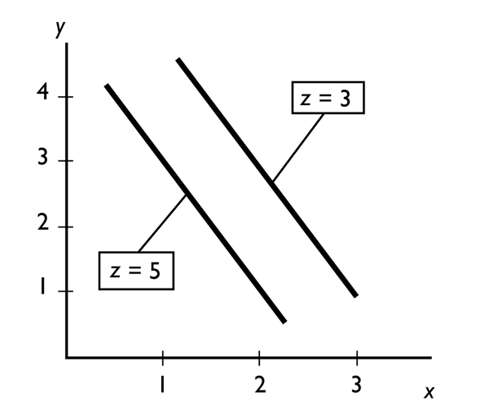
In the figure above, an increase in z leads to a
A) leftward shift of the line showing the relationship between x and y.
B) rightward shift of the line showing the relationship between x and y.
C) movement down along one of the lines showing the relationship between x and y.
D) movement up along one of the lines showing the relationship between x and y.
E) trend change in both x and y.
Correct Answer:

Verified
Correct Answer:
Verified
Q92: A time series graph<br>A)is not useful if
Q93: The slope<br>A)equals the change in the value
Q94: <img src="https://d2lvgg3v3hfg70.cloudfront.net/TB2787/.jpg" alt=" In the figure
Q95: To help unscramble cause and effect, economists<br>A)must
Q96: When economists use the term "correlation," they
Q98: When unskilled teens earn less than college
Q99: If the change in y = 10
Q100: <img src="https://d2lvgg3v3hfg70.cloudfront.net/TB2787/.jpg" alt=" The above figure
Q101: <img src="https://d2lvgg3v3hfg70.cloudfront.net/TB2787/.jpg" alt=" The figure
Q102: In a graph, a straight line has