Multiple Choice
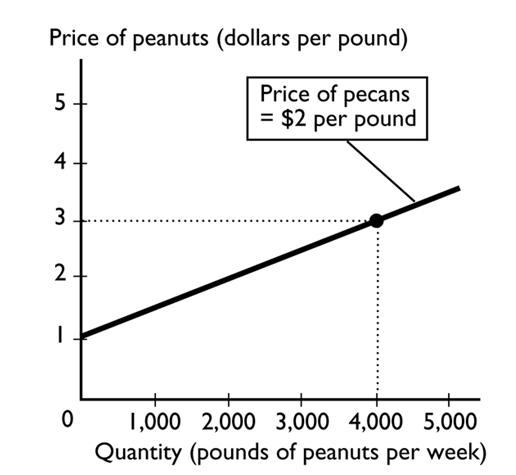
In the figure above, suppose the price of a pound of pecans is negatively related to the quantity of peanuts that farmers are willing to supply. If the price of pecans increases,
A) the curve will shift leftward.
B) the curve will shift rightward.
C) the curve will be unaffected.
D) there is a movement along the curve.
E) None of the above answers is correct because the graph assumes that the price of pecans does not change.
Correct Answer:

Verified
Correct Answer:
Verified
Q89: If a small change in the x
Q90: <img src="https://d2lvgg3v3hfg70.cloudfront.net/TB2787/.jpg" alt=" The relationship between
Q91: To economists, scarcity means that<br>A)a person looking
Q92: A time series graph<br>A)is not useful if
Q93: The slope<br>A)equals the change in the value
Q95: To help unscramble cause and effect, economists<br>A)must
Q96: When economists use the term "correlation," they
Q97: <img src="https://d2lvgg3v3hfg70.cloudfront.net/TB2787/.jpg" alt=" In the figure
Q98: When unskilled teens earn less than college
Q99: If the change in y = 10