Multiple Choice
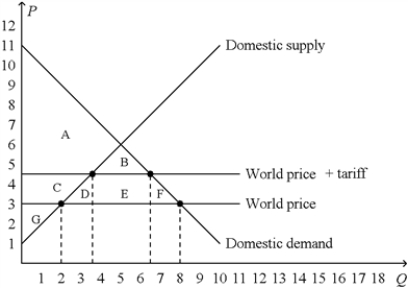
Figure 9-16.The figure below illustrates a tariff.On the graph,Q represents quantity and P represents price. 
-Refer to Figure 9-16.Government revenue raised by the tariff is represented by the area
A) E.
B) B + E.
C) D + E + F.
D) B + D + E + F.
Correct Answer:

Verified
Correct Answer:
Verified
Q57: When the nation of Duxembourg allows trade
Q241: Figure 9-2<br>The figure illustrates the market for
Q242: Figure 9-17 <img src="https://d2lvgg3v3hfg70.cloudfront.net/TB2297/.jpg" alt="Figure 9-17
Q243: Figure 9-18.On the diagram below,Q represents the
Q244: Figure 9-10.The figure applies to Mexico and
Q245: A major difference between tariffs and import
Q247: Some goods can be produced at low
Q249: Figure 9-25<br>The following diagram shows the domestic
Q250: Trade raises the economic well-being of a
Q251: Figure 9-7.The figure applies to the nation