Multiple Choice
Figure 9-17 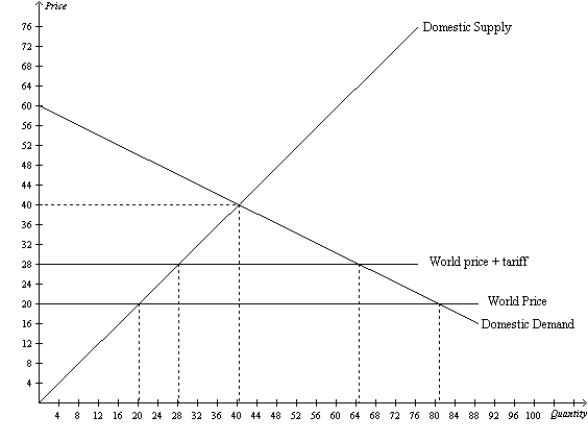
-Refer to Figure 9-17.When comparing no trade to free trade,the gains from trade amount to
A) $400.
B) $600.
C) $750.
D) $1,000.
Correct Answer:

Verified
Correct Answer:
Verified
Related Questions
Q210: Figure 9-18.On the diagram below,Q represents the
Q211: Figure 9-18.On the diagram below,Q represents the
Q212: Both tariffs and import quotas<br>A)increase the quantity
Q213: Figure 9-20<br>The figure illustrates the market for
Q214: Figure 9-5<br>The figure illustrates the market for
Q216: When a country that imports a particular
Q217: Figure 9-5<br>The figure illustrates the market for
Q218: Figure 9-14.On the diagram below,Q represents the
Q219: Figure 9-21<br>The following diagram shows the domestic
Q220: Honduras is an importer of goose-down pillows.The