Essay
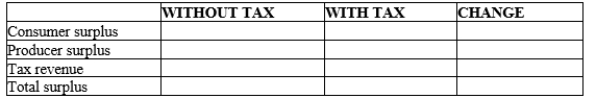
Use the following graph shown to fill in the table that follows. 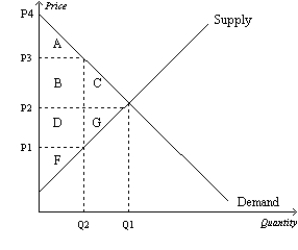
Correct Answer:

Verified
Correct Answer:
Verified
Related Questions
Q1: Figure 8-9<br>The vertical distance between points A
Q19: Taxes drive a wedge into the market
Q26: Figure 8-20<br>On the vertical axis of each
Q48: Figure 8-25 <img src="https://d2lvgg3v3hfg70.cloudfront.net/TB2297/.jpg" alt="Figure 8-25
Q130: Figure 8-13 <img src="https://d2lvgg3v3hfg70.cloudfront.net/TB2297/.jpg" alt="Figure 8-13
Q138: Figure 8-6<br>The vertical distance between points A
Q138: The Social Security tax, and to a
Q147: Tax revenues increase in direct proportion to
Q186: Scenario 8-1<br>Erin would be willing to pay
Q211: Figure 8-6<br>The vertical distance between points A