Essay
Using the graph shown, construct a demand curve for M&M's given an income of $10. 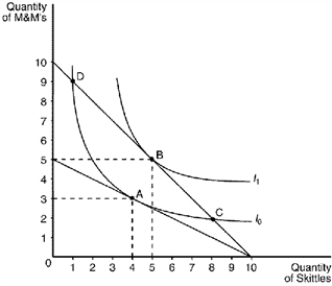
Correct Answer:

Verified
Correct Answer:
Verified
Related Questions
Q25: Figure 21-25 The figure pertains to a
Q35: When we draw Katie's indifference curves to
Q48: Figure 21-32 The figure shows three indifference
Q85: A normal good is one<br>A)the average consumer
Q89: Figure 21-9 <img src="https://d2lvgg3v3hfg70.cloudfront.net/TB1273/.jpg" alt="Figure 21-9
Q115: If a good is a Giffen good,
Q118: Irene is a vegetarian, so she does
Q221: Figure 21-24 The figure shows three indifference
Q322: Figure 21-8 <img src="https://d2lvgg3v3hfg70.cloudfront.net/TB1273/.jpg" alt="Figure 21-8
Q372: Michael faces tradeoffs between consuming in the