Multiple Choice
The following diagram shows one indifference curve representing the preferences for goods X and Y for one consumer. 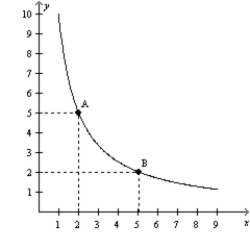 What is the marginal rate of substitution between points A and B?
A) 2/5
B) 1
C) 5/2
D) 3
Correct Answer:

Verified
Correct Answer:
Verified
Q17: Figure 21-2 The downward-sloping line on the
Q28: Figure 21-11 <img src="https://d2lvgg3v3hfg70.cloudfront.net/TB1273/.jpg" alt="Figure 21-11
Q36: Which of the following examples would illustrate
Q90: Suppose a consumer has an income of
Q114: You can think of an indifference curve
Q122: Figure 21-24 The figure shows three indifference
Q128: Indifference curves illustrate<br>A)a firm's profits.<br>B)a consumer's budget.<br>C)a
Q167: Table 21-3<br><br>Ethan consumes two goods, milk
Q336: All Giffen goods are<br>A)inferior goods, and all
Q368: If the consumer's income and all prices