Multiple Choice
Exhibit 19-4
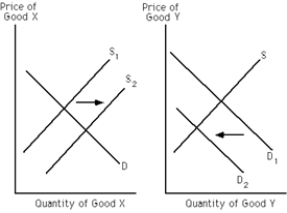
-Refer to Exhibit 19-4. As a consequence of the depicted change in the supply of X, the demand curve for Y shifted from D1 to D2. Which of the following pairs of goods are most likely represented by X and Y?
A) cars and gasoline
B) brand A peanut butter and brand B peanut butter
C) water and diamonds
D) milk and cereal
E) a and d
Correct Answer:

Verified
Correct Answer:
Verified
Q4: As the price of a good falls
Q5: The longer the period of time allowed
Q6: If Casey bought 16 cotton t-shirts last
Q7: Cross elasticity of demand is the percentage
Q8: Price elasticity of demand is a measure
Q10: Exhibit 19-5<br><br> <img src="https://d2lvgg3v3hfg70.cloudfront.net/TB6992/.jpg" alt="Exhibit 19-5
Q11: Exhibit 19-5<br><br> <img src="https://d2lvgg3v3hfg70.cloudfront.net/TB6992/.jpg" alt="Exhibit 19-5
Q12: If the demand for a good is
Q13: If Jack bought 18 CDs last year
Q14: If price elasticity of supply is greater