Multiple Choice
Exhibit 19-5
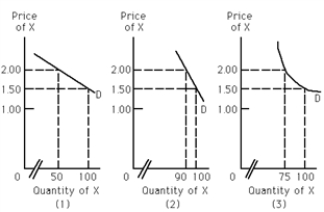
-Refer to Exhibit 19-5. Assume that the seller of X increases the price from $1.50 to $2.00, and this results in an increase in total revenue. Which of the graphs represents the demand curve for X?
A) (1)
B) (2)
C) (3)
D) all of the above
Correct Answer:

Verified
Correct Answer:
Verified
Q5: The longer the period of time allowed
Q6: If Casey bought 16 cotton t-shirts last
Q7: Cross elasticity of demand is the percentage
Q8: Price elasticity of demand is a measure
Q9: Exhibit 19-4<br><br> <img src="https://d2lvgg3v3hfg70.cloudfront.net/TB6992/.jpg" alt="Exhibit 19-4
Q11: Exhibit 19-5<br><br> <img src="https://d2lvgg3v3hfg70.cloudfront.net/TB6992/.jpg" alt="Exhibit 19-5
Q12: If the demand for a good is
Q13: If Jack bought 18 CDs last year
Q14: If price elasticity of supply is greater
Q15: Suppose that the quantity demanded of good