Short Answer
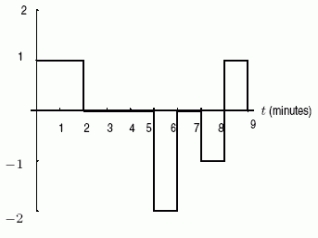
A car is moving along a straight road from A to B, starting from A at time t = 0.Below are graphs of the velocity and the acceleration plotted against time (positive direction is from A to B)
A)The one on the right
B)The one on the left. Which graph shows the velocity?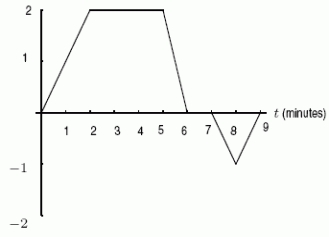
Correct Answer:

Verified
Correct Answer:
Verified
Q36: Suppose <span class="ql-formula" data-value="\int_{a}^{b} g(x)
Q37: The velocity and acceleration of an
Q38: If <span class="ql-formula" data-value="\int_{-2}^{7} f(x)
Q39: Estimate <span class="ql-formula" data-value="\int_{3}^{4} \ln
Q40: Use the table to estimate
Q42: At time t, in seconds, your
Q43: Evaluate the definite integral <span
Q44: If <span class="ql-formula" data-value="\int_{a}^{b} f(x)=0"><span
Q45: Evaluate <span class="ql-formula" data-value="\int_{1}^{5} 3
Q46: Let <span class="ql-formula" data-value="\int_{0}^{8} f(x)