Short Answer
Below is the graph of the rate r at which people arrive for lunch at Cafeteria Charlotte.Checkers start at 12:00 noon and can pass people through at a constant rate of 5 people/minute.Let f(t)be the length of the line (i.e.the number of people)at time t.Suppose that at 11:50 there are already 150 people lined up.Using the graph together with this information, is f concave up or down on the interval 11:55 < t < 12:07? 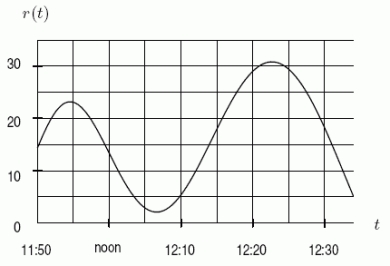
Correct Answer:

Verified
Correct Answer:
Verified
Q98: A spherical lollipop has a circumference
Q99: A lady bug moves on the
Q100: A student is drinking a milkshake with
Q101: Determine the equation of the tangent
Q102: Sketch a graph of a function
Q103: A normal distribution in statistics is
Q104: The cost C(q)(in dollars)of producing a
Q105: Below is the graph of the
Q106: Consider the one-parameter family of functions
Q108: Determine the <span class="ql-formula" data-value="\lim