Multiple Choice
The cost C(q) (in dollars) of producing a quantity q of a certain product is shown in the graph below.The average cost is given by .Graphically, a(q) is the slope of the line between which two points? 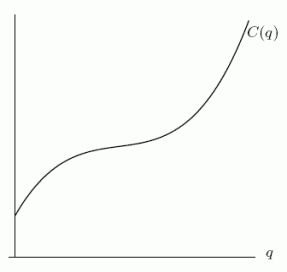
A) (0, 0)
B)
C) (0, q)
D)
Correct Answer:

Verified
Correct Answer:
Verified
Related Questions
Q98: A spherical lollipop has a circumference
Q99: A lady bug moves on the
Q100: A student is drinking a milkshake with
Q101: Determine the equation of the tangent
Q102: Sketch a graph of a function
Q103: A normal distribution in statistics is
Q105: Below is the graph of the
Q106: Consider the one-parameter family of functions
Q107: Below is the graph of the rate
Q108: Determine the <span class="ql-formula" data-value="\lim