Essay
Below is the graph of the rate r at which people arrive for lunch at Cafeteria Charlotte.Checkers start at 12:00 noon and can pass people through at a constant rate of 5 people/minute.Let f(t)be the length of the line (i.e.the number of people)at time t.Suppose that at 11:50 there are already 150 people lined up.Using the graph together with this information, sketch a graph of f. 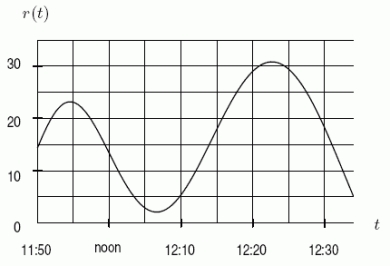
Correct Answer:

Verified
Correct Answer:
Verified
Q58: One fine day you take a
Q59: A single cell of a bee's
Q60: Consider the two-parameter family of curves
Q61: A lady bug moves on the
Q62: Consider the function <span class="ql-formula"
Q64: A window with a rectangular base is
Q65: Given the table of data about
Q66: One fine day you take a
Q67: Consider the function <span class="ql-formula"
Q68: When light strikes a shiny surface,