Short Answer
Below is the graph of the rate r at which people arrive for lunch at Cafeteria Charlotte.Checkers start at 12:00 noon and can pass people through at a constant rate of 5 people/minute.Let f(t)be the length of the line (i.e.the number of people)at time t.Suppose that at 11:50 there are already 150 people lined up.Using the graph together with this information, when is the line the longest? 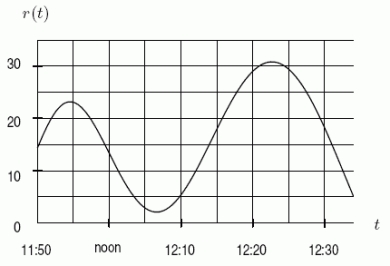
Correct Answer:

Verified
Correct Answer:
Verified
Q86: A lady bug moves on the
Q87: Consider a continuous function with the
Q88: A fan is watching a 100-meter footrace
Q89: Below is the graph of the
Q90: For <span class="ql-formula" data-value="f(x)=4 \cos
Q92: Find the limit: <span class="ql-formula"
Q93: The revenue for selling q items
Q94: Which of the following parametric equations
Q95: The cost C(q)(in dollars)of producing a
Q96: The equations <span class="ql-formula" data-value="x=\frac{9}{\pi}