Multiple Choice
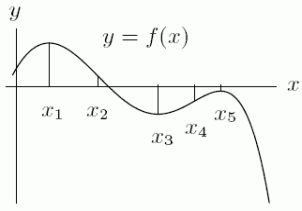
The graph of
is given in the following figure.What happens to
at the point
? 

A)
has an inflection point.
B)
has a local minimum or maximum.
C)
changes sign.
D) none of the above
Correct Answer:

Verified
Correct Answer:
Verified
Related Questions
Q68: A golf ball thrown directly upwards
Q69: The graph below represents the rate
Q70: On the axes below, sketch a smooth,
Q71: Assume that f is a differentiable function
Q72: A company graphs C'(t), the derivative of
Q74: The graph below shows the velocity of
Q75: Esther is a swimmer who prides
Q76: Is the function <span class="ql-formula"
Q77: To find the derivative of
Q78: Is the graph of <span