Multiple Choice
The graph below represents the rate of change of a function f with respect to x; i.e., it is a graph of f '.You are told that f (0) = 0.What can you say about
at the point x = 1.3? Mark all that apply. 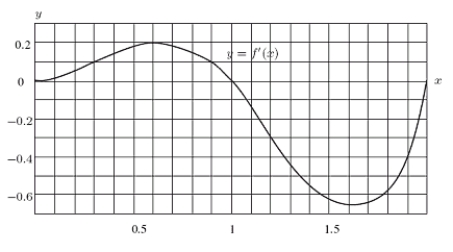
A) is decreasing.
B)
is increasing.
C)
is concave up.
D)
is concave down.
Correct Answer:

Verified
Correct Answer:
Verified
Q64: A golf ball thrown directly upwards
Q65: For <span class="ql-formula" data-value="f(x)=\log x"><span
Q66: A typhoon is a tropical cyclone, like
Q67: A runner competed in a half marathon
Q68: A golf ball thrown directly upwards
Q70: On the axes below, sketch a smooth,
Q71: Assume that f is a differentiable function
Q72: A company graphs C'(t), the derivative of
Q73: The graph of <span class="ql-formula"
Q74: The graph below shows the velocity of