True/False
A pond has a population of 500 frogs.Over a ten-year period of time the number of frogs drops quickly by 20%, then increases slowly for 5 years before dropping to almost zero.Does the following graph accurately represent the number of frogs in the pond over the ten-year period of time? 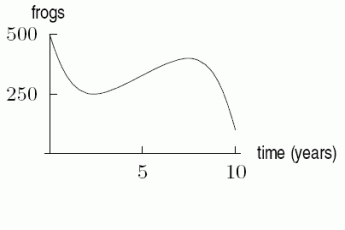
Correct Answer:

Verified
Correct Answer:
Verified
Q17: Consider the graph of the function
Q18: A population of bacteria is introduced
Q19: Suppose we buy quantities <span
Q20: Given the information in the table
Q21: Suppose there is an initial population of
Q23: You have $500 invested in a bank
Q24: Is the function <span class="ql-formula"
Q25: If <span class="ql-formula" data-value="f(x)"><span class="katex"><span
Q26: Could the function described by the
Q27: Use algebra to evaluate the right-hand