Multiple Choice
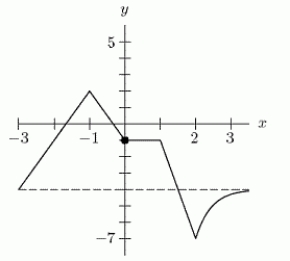
The graph of y = f(x) is shown in the first figure.What graph is shown in the second figure? 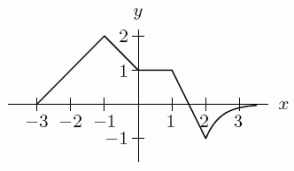
A)
B)
C)
D)
Correct Answer:

Verified
Correct Answer:
Verified
Related Questions
Q33: Suppose <span class="ql-formula" data-value="\lim _{x
Q34: Suppose we buy quantities <span
Q35: Is the function <span class="ql-formula"
Q36: Using the standard viewing rectangle (-10
Q37: Here are some data from a Scientific
Q39: Is the function <span class="ql-formula"
Q40: Sketch a graph of a function on
Q41: Draw a graph which accurately represents the
Q42: Cramped Quarters Island is a tiny
Q43: What is the period of the