Multiple Choice
The graph shows enzyme activity as a function of temperature for a mesophilic microbe. How would you predict that the graph would change if the organism was a psychrophile (an organism that thrives at low temperatures) ? 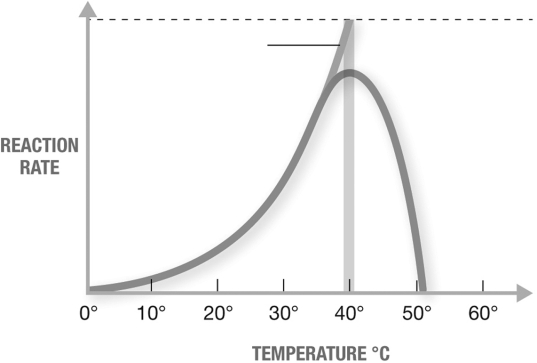
A) The graph would be similar, but would be shifted toward the right.
B) The graph would be a horizontal straight line.
C) The graph would be similar, but would be shifted toward the left.
D) The graph would not peak then drop off, but would continue rising indefinitely.
E) The graph would be wider (extended further both left and right) but the peak would be lower.
Correct Answer:

Verified
Correct Answer:
Verified
Q50: Which of the following pathways are operational
Q51: A pathway that functions simultaneously in both
Q52: Besides biochemical tests, which techniques are also
Q53: In chemiosmosis, protons funnel through ATP synthase
Q54: Which coenzyme is incorrectly matched with its
Q55: Which category of biochemical tests is incorrectly
Q56: Which is the key difference between aerobic
Q57: Which structural and functional feature(s) listed are
Q58: Which is not one of the categories
Q59: Which facts about enzymes are not visualized