Multiple Choice
Figure 7.3
Assume 109 E. coli cells/ml are in a flask.
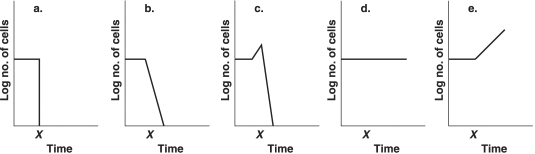
-Which graph in Figure 7.3 best depicts the effect of placing the culture at 7°C at time x?
A) a
B) b
C) c
D) d
E) e
Correct Answer:

Verified
Correct Answer:
Verified
Related Questions
Q2: Figure 7.2<br>A suspension of 106 Bacillus cereus
Q3: Place the following surfactants in order from
Q4: Table 7.2<br>The fate of E. coli
Q5: Which concentration of ethyl alcohol is the
Q6: Which of the following affects the elimination
Q7: Which of the following is a limitation
Q8: Which one of the following does not
Q9: Phenolics differ from phenol in that phenolics
Q10: Figure 7.2<br>A suspension of 106 Bacillus cereus
Q11: Which one of the following is most