True/False
Given below is the scatter plot of the number of employees and the total revenue ($millions) of 20 U.S.companies.There appears to be a positive relationship between total revenue and the number of employees. 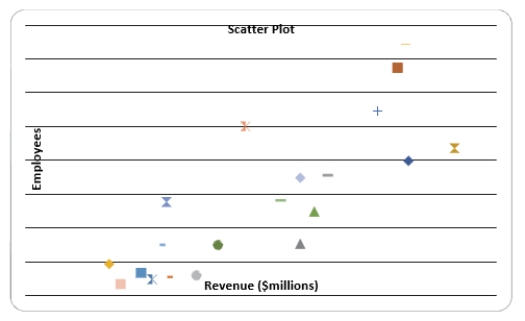
Correct Answer:

Verified
Correct Answer:
Verified
Q10: In graphing two categorical data,the side-by-side bar
Q18: SCENARIO 2-10<br>The histogram below represents scores achieved
Q57: A research analyst was directed to arrange
Q63: One of the developing countries is experiencing
Q80: SCENARIO 2-16 The figure below is the
Q111: SCENARIO 2-2<br>2-2 Organizing and Visualizing Variables<br>At a
Q157: SCENARIO 2-14 <br>The table below contains the
Q159: SCENARIO 2-11<br>The ordered array below resulted from
Q162: One of the advantages of a pie
Q177: SCENARIO 2-14 <br>The table below contains the