True/False
Given below is the scatter plot of the price/earnings ratio versus earnings per share of 20 U.S.companies.There appears to be a negative relationship between price/earnings ratio and earnings per share. 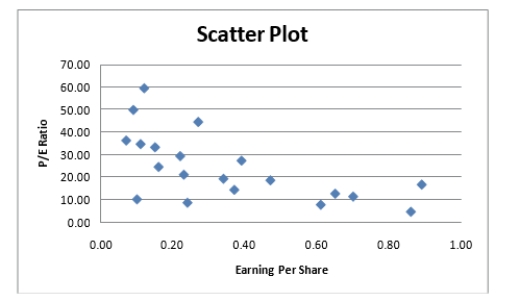
Correct Answer:

Verified
Correct Answer:
Verified
Q5: SCENARIO 2-5<br>The following are the duration in
Q41: SCENARIO 2-12 The table below contains the
Q47: The point halfway between the boundaries of
Q61: SCENARIO 2-10<br>The histogram below represents scores achieved
Q101: The sum of relative frequencies in a
Q116: SCENARIO 2-11<br>The ordered array below resulted from
Q133: SCENARIO 2-18<br>The stem-and-leaf display below shows the
Q144: SCENARIO 2-14 <br>The table below contains the
Q173: SCENARIO 2-12<br>The table below contains the opinions
Q173: SCENARIO 2-5<br>The following are the duration in