True/False
Given below is the scatter plot of the number of employees and the total revenue ($millions) of 20 U.S.companies.Companies that have higher numbers of employees appear to also have higher total revenue. 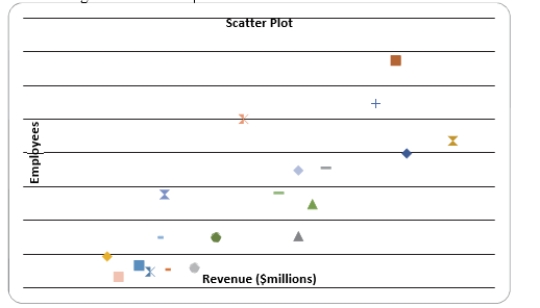
Correct Answer:

Verified
Correct Answer:
Verified
Related Questions
Q4: Apple Computer,Inc.collected information on the age of
Q33: In general,a frequency distribution should have at
Q71: You have collected information on the market
Q82: SCENARIO 2-14 <br>The table below contains the
Q94: SCENARIO 2-15 The figure below is the
Q95: SCENARIO 2-14 <br>The table below contains the
Q103: SCENARIO 2-12<br>The table below contains the opinions
Q155: SCENARIO 2-14 <br>The table below contains the
Q170: SCENARIO 2-14 <br>The table below contains the
Q176: A professor of economics at a small