Essay
Exhibit 4-5
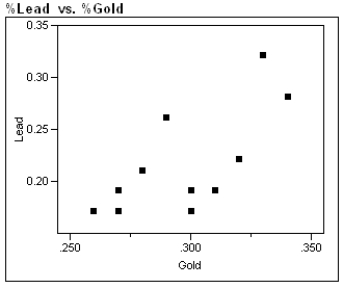
During the first 3 centuries AD, the Roman Empire produced coins in the Eastern provinces. Some historians argue that not all these coins were produced in local mints, and further that the mint of Rome struck some of them. Because the "style" of coins is difficult to analyze, the historians would like to use metallurgical analysis as one tool to identify the source mints of these coins. Investigators studied 11 coins known to have been produced by local mints in an attempt to identify a trace element profile for these coins, and have identified gold and lead as possible factors in identifying other coins as having been locally minted. The gold and lead content, measured as a % of weight of each coin, is given in the table, and a scatter plot of these data is presented below. 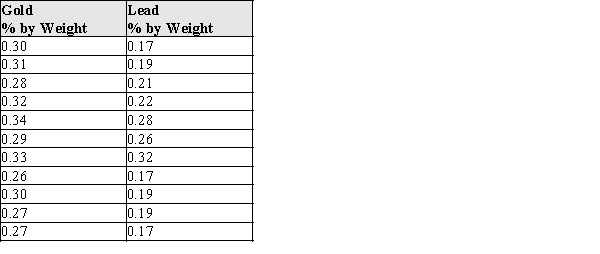
-Refer to Exhibit 4-5.
a)What is the equation of the least squares best fit line?
b)Sketch the best fit line on the scatter plot.
c)What is the value of the correlation coefficient? Interpret this value.
d)What is the value of the coefficient of determination? Give an interpretation of this value.
Correct Answer:

Verified
a)  , where L is the % lead content and ...
View Answer
Unlock this answer now
Get Access to more Verified Answers free of charge
Correct Answer:
Verified
View Answer
Unlock this answer now
Get Access to more Verified Answers free of charge
Q24: If r is close to 1, then
Q28: Data on x = the weight of
Q29: A transformation, or reexpression, of a variable
Q29: Exhibit 4-2<br>The theory of fiber strength suggests
Q30: The value of the residual plus <img
Q33: Which of the following indicates the range
Q34: If <img src="https://d2lvgg3v3hfg70.cloudfront.net/TB7677/.jpg" alt="If ,
Q35: According to official data of "http://www.census.org/" population
Q36: The data below were gathered on a
Q37: Data were collected on y = price