Essay
The data below were gathered on a random sample of 5 basking sharks, swimming through the water and filter-feeding, i.e. passively letting the water bring food into their mouths. 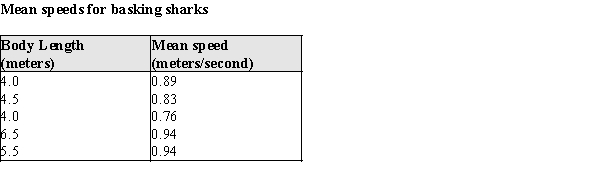
a)What is the value of the correlation coefficient for these data?
b)What is the equation of the least squares line describing the relationship between
x = body length and y = mean speed.
c)If these sharks are representative of the population of basking sharks, what would you predict is the mean speed for a filter-feeding basking shark that is 5.0 meters in length? Show any calculations below.
d)The largest basking shark in the sample is measured as 6.5 meters long. Theory predicts a maximum length of about 12.26 meters. Would it be reasonable to use the equation from part (b) above to predict the mean filter-feeding speed for a 12 meter long basking shark? Why or why not?
Correct Answer:

Verified
a)r = 0.7492
b)  = 0.61 + 0.0534x
c)0.61...View Answer
Unlock this answer now
Get Access to more Verified Answers free of charge
Correct Answer:
Verified
b)
c)0.61...
View Answer
Unlock this answer now
Get Access to more Verified Answers free of charge
Q29: A transformation, or reexpression, of a variable
Q32: Exhibit 4-5<br>During the first 3 centuries AD,
Q33: Which of the following indicates the range
Q34: If <img src="https://d2lvgg3v3hfg70.cloudfront.net/TB7677/.jpg" alt="If ,
Q35: According to official data of "http://www.census.org/" population
Q35: The slopes of the least squares lines
Q37: Data were collected on y = price
Q38: Exhibit 4-4:<br>Biological theory suggests that the relationship
Q40: When children and adolescents are discharged from
Q41: One of the problems when estimating the