Multiple Choice
The plot given below shows the points and the regression lines for the data set on the same graph. The blue line is the regression line for all points. The red line is the regression line for the data points excluding those which influence observation. 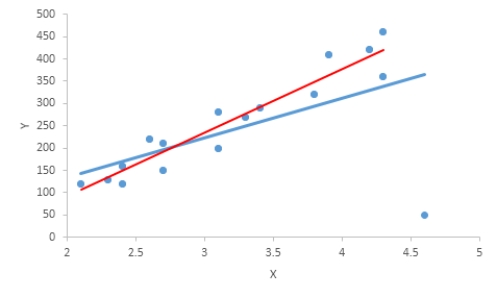 Describe the effect of the influential observation on the equation of the least squares regression line. Select the correct statement.
A) The influential observation changes the equation of the regression line.
B) The influential observation is located long far from the other data points.
C) The influential observation only increases the error of estimation.
D) The influential observation is always an outlier.
Correct Answer:

Verified
Correct Answer:
Verified
Q26: The higher the value of the coefficient
Q35: The slopes of the least squares lines
Q38: Exhibit 4-4:<br>Biological theory suggests that the relationship
Q40: When children and adolescents are discharged from
Q41: One of the problems when estimating the
Q42: We know that the linear regression must
Q45: Identify linear patterns in the scatterplots shown.<br>A)
Q46: A common statistical method for estimating a
Q47: The breeding success of birds that nest
Q48: Exhibit 4-1<br>The preservation of objects made of