Essay
One of the problems when estimating the size of animal populations from aerial surveys is that animals may bunch together, making it difficult to distinguish and count them accurately. For example, a horse standing alone is easy to spot; if seven horses huddled close together some may be missed, resulting in an undercount. The relative frequency of undercounts is typically reported as a percent. For example, if there are 10 horses in a group, a person in the plane may typically count fewer than 10 horses 20% of the time. In a recent study, the percent of sightings that resulted in an undercount was related to the size of the "group" of horses and donkeys; the following data were gathered: 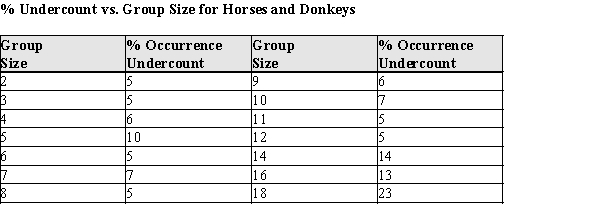 After fitting a straight line model,
  , significant curvature was detected in the residual plot, and two nonlinear models were chosen for further analysis, the exponential and the power models. The computer output for these models is given below, and the residual plots follow.
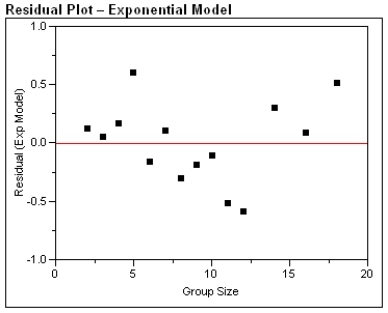
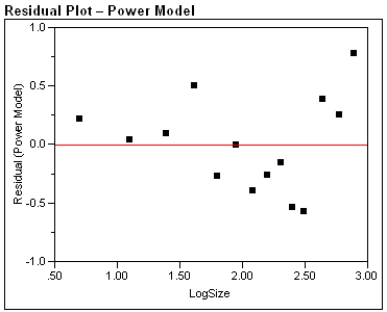
 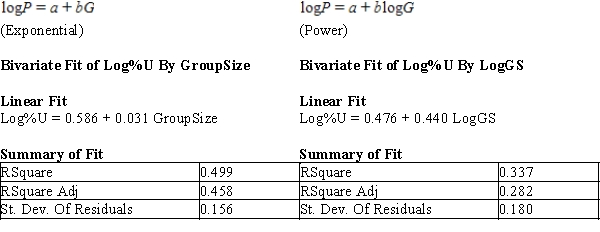 Residual Plots

 a)For the exponential model, calculate the predicted log (%undercount) for a group size = 10.
b)Use your calculations from part (a) to predict the %undercount for a group size = 10.
c)Generally speaking, which of the two models, power or exponential, is better at predicting the log (Percent Undercount)? Provide statistical justification for your choice.
Correct Answer:

Verified
a)log10(P) = 0.586 + 0.031G = 0.586 + 0.03...View Answer
Unlock this answer now
Get Access to more Verified Answers free of charge
Correct Answer:
Verified
View Answer
Unlock this answer now
Get Access to more Verified Answers free of charge
Q26: The higher the value of the coefficient
Q35: The slopes of the least squares lines
Q36: The data below were gathered on a
Q37: Data were collected on y = price
Q38: Exhibit 4-4:<br>Biological theory suggests that the relationship
Q40: When children and adolescents are discharged from
Q42: We know that the linear regression must
Q43: The plot given below shows the points
Q45: Identify linear patterns in the scatterplots shown.<br>A)
Q46: A common statistical method for estimating a