Multiple Choice
To compare the average weekly earnings of full-time wages of male and female workers, twenty men and twenty women were selected. The following table contains average weekly wages of each person in the current month. 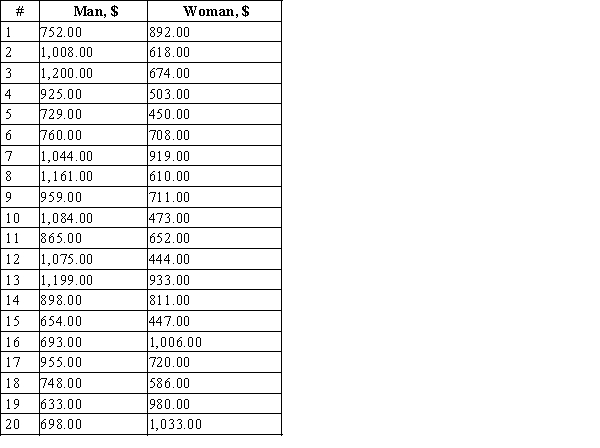 Use boxplot to make comparisons between weekly salary for man and woman.
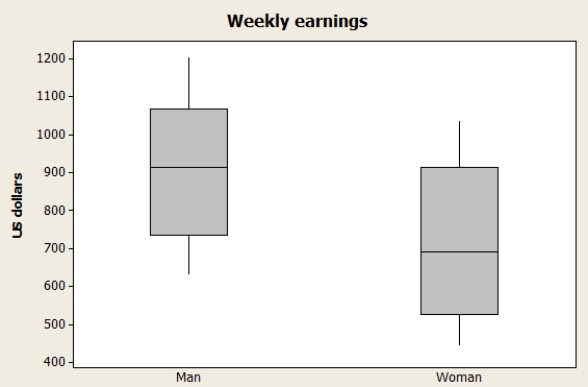
A) From the comparative boxplot, you can see that both data distributions are approximately symmetric, but wages of male workers tend to be higher than wages of female workers.We can conclude that wages of male workers are greater than wages of female workers.
B) From the comparative boxplot, you can see that both data distributions are approximately symmetric, but wages of female workers tend to be higher than wages of male workers.We can conclude that wages of female workers are greater than wages of male workers.
C) From the comparative boxplot, you can see that both data distributions are skewed to the left, but the mean of the data for men lies higher than the mean of the data for women.So, we can conclude that wages of male workers are greater than wages of female workers.
D) From the comparative boxplot, you can see that both data distributions are skewed to the left, but the mean of the data for women lies higher than the mean of the data for men.So, we can conclude that wages of male workers are greater than wages of female workers.
E) It is not a representative sample, and we cannot make any conclusions about the difference between the wages of male and female workers.
Correct Answer:

Verified
Correct Answer:
Verified
Q2: The mean is the middle value of
Q23: The mean number of text messages sent
Q24: A common topic of study among biologists
Q24: For any given data set, the median
Q25: Suppose that the distribution of weekly water
Q26: Data on tipping percent for 20 restaurant
Q29: The questions below refer to decisions made
Q30: The Territory of Iowa was initially surveyed
Q31: The % by weight of the element
Q32: The dot plot below shows the annual