Multiple Choice
The dot plot below shows the annual salaries, in thousands of dollars, of a sample of non-management staff who work for a small banking company. 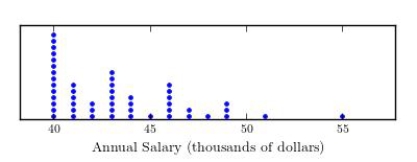 Which of the following statistics would be the most reasonable estimate of the typical annual salary?
A) mean
B) mode
C) median
D) interquartile range
E) range
Correct Answer:

Verified
Correct Answer:
Verified
Q4: The interquartile range is resistant to the
Q24: For any given data set, the median
Q26: The variance is the positive square root
Q27: To compare the average weekly earnings of
Q29: The questions below refer to decisions made
Q30: The Territory of Iowa was initially surveyed
Q31: The % by weight of the element
Q33: Which of the five boxplots shown in
Q34: Data on weekday exercise time (in minutes)
Q36: The following nitrous oxide emissions (in thousands