Essay
Exhibit 2-3
There has been a recent increase in the popularity of caffeine-containing "energy drinks" or "functional beverages"--substances that are considered to be food that may provide some health benefit. However, caffeine in these drinks presents an important health concern, especially for women of childbearing age. Studies have shown an increased risk of spontaneous abortion and low birth weight children to women consuming more than 150 mg/day of caffeine. In a recent study, eighteen 12-oz servings of different brands of carbonated sodas were analyzed to ascertain their caffeine content, with the results presented below. The data are in mg/12-oz serving; if no caffeine was detected, this is reported as "* mg/serving."
Caffeine (mg) in 12 oz servings of Carbonated Sodas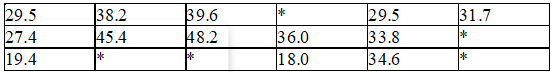
-Refer to Exhibit 2-3.
a)Construct a comparative (back to back) stem & leaf plot for the container vs. fountain amounts of caffeine. (Do not use the data for carbonated sodas where caffeine was not detected.) Describe how the two distributions compare.
(b)What do you think might explain the differences between the two distributions?
Correct Answer:

Verified
a)
b) There does not appear to be an app...View Answer
Unlock this answer now
Get Access to more Verified Answers free of charge
Correct Answer:
Verified
b) There does not appear to be an app...
View Answer
Unlock this answer now
Get Access to more Verified Answers free of charge
Q1: A data set consisting of many observations
Q3: Frequency distributions can only be used with
Q10: Bar charts should be used with categorical
Q11: A data set is discrete if the
Q51: In a survey of 30 working adults
Q52: A survey form solicited the following responses:<br>
Q54: As part of the United States Census,
Q55: In a study of how college students
Q58: In birds, the muscles that pull the
Q61: Bird-plane collisions<br>Collisions between birds and airplanes are