Essay
As part of the United States Census, data is also collected on the number of persons in each household. The census data for four decades is summarized below. 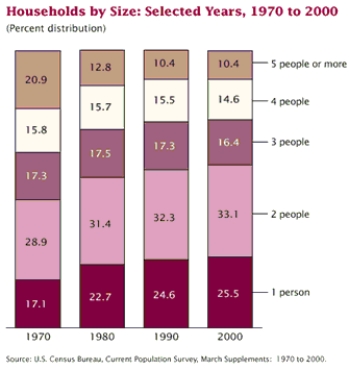 (a)In a few sentences describe how the proportion of households with 4 people has changed from 1970 to 2000.
(b)What size of household appears to have decreased the most from 1970 to 2000?
Correct Answer:

Verified
a)The proportion of households with 4 pe...View Answer
Unlock this answer now
Get Access to more Verified Answers free of charge
Correct Answer:
Verified
View Answer
Unlock this answer now
Get Access to more Verified Answers free of charge
Q1: A data set consisting of many observations
Q3: Frequency distributions can only be used with
Q10: Bar charts should be used with categorical
Q16: A pie chart is most useful for
Q49: One interesting aspect of surveys is that
Q51: In a survey of 30 working adults
Q52: A survey form solicited the following responses:<br>
Q55: In a study of how college students
Q56: Exhibit 2-3<br>There has been a recent increase
Q58: In birds, the muscles that pull the