Multiple Choice
According to the data from fec.gov, since the year 1980, in Texas candidates from the Republican Party won the presidential elections. Following table represents the results of elections since 1984. 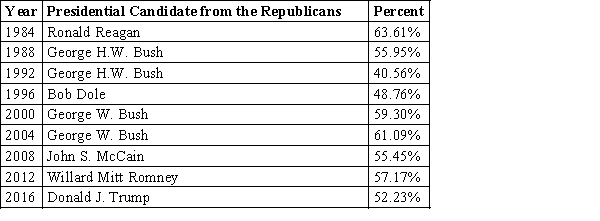 Choose the most appropriate graphical display for the results of elections in Texas.
A) Bar Chart
B) Comparative Bar Chart
C) Time Series Plot
D) Stem-and-Leaf Display
E) Histogram
Correct Answer:

Verified
Correct Answer:
Verified
Q7: Dotplots work best for small and moderate
Q8: One advantage of histograms is that they
Q39: A statewide survey released by the University
Q40: One of the "media messages" sent by
Q42: Records of the missions of Baja California
Q45: The quantity <img src="https://d2lvgg3v3hfg70.cloudfront.net/TB7677/.jpg" alt="The quantity
Q46: Biologists know that bats have different flight
Q47: Artificial bird nests have been used extensively
Q48: Exhibit 2-4<br>In the article, "Scaling of Mammalian
Q49: One interesting aspect of surveys is that