Essay
A statewide survey released by the University of Iowa Injury Prevention Research Center was designed to assess compliance with Iowa seatbelt law. The table below shows the results for 5 Iowa cities. 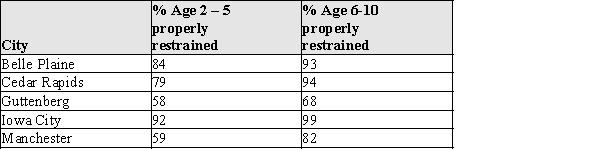
(a)Display these data in a comparative bar chart so that the different ages can be compared for the different cities.
(b)Write a brief description of the differences and similarities in the patterns you observe in your bar chart for part (a).
Correct Answer:

Verified
(a)  (b)The patterns across ages are the...
View Answer
Unlock this answer now
Get Access to more Verified Answers free of charge
Correct Answer:
Verified
View Answer
Unlock this answer now
Get Access to more Verified Answers free of charge
Q7: Dotplots work best for small and moderate
Q8: One advantage of histograms is that they
Q34: Exhibit 2-3<br>There has been a recent increase
Q35: The annual household incomes, in thousands of
Q36: A survey asked adult respondents how dependent
Q37: According to the stem-and-leaf display below, how
Q38: The pie chart below summarizes the results
Q40: One of the "media messages" sent by
Q42: Records of the missions of Baja California
Q44: According to the data from fec.gov, since