Multiple Choice
A study was carried out to investigate the relationship between x = the number of components needing repair and y = the time of the service call (in minutes) for a computer repair company. The number of components and the service times for a random sample of 20 service calls were used to fit a simple linear regression model. Partial computer output is shown below. ______________________________________________________________
The regression equation is Time = 32.441 + 11.6205 Number 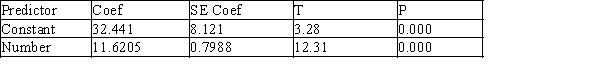
S=19.058, R-Sq=91.3%, R-Sq(adj) =90.0%
______________________________________________________________
One of the numbers in the above computer output indicates the percentage of the observed variation in the service call times that can be explained by the linear relationship between service call time and number of components needing repair.
What is the value of this number?
A) 91.3
B) 90.0
C) 19.058
D) 32.441
E) 0.7988
Correct Answer:

Verified
Correct Answer:
Verified
Q1: The expected change in the value of
Q8: What are the four "Basic Assumptions" of
Q21: The estimated standard deviation, s<sub>e</sub>, has n
Q25: The estimated mean value of y is
Q35: In a random sample of large cities
Q37: If there is a negative linear relationship
Q39: The computer output given below shows a
Q40: The scatter plot and residual plot shown
Q41: When the four basic assumptions for a
Q43: If there is no evidence of a