Essay
The scatter plot and residual plot shown below are from a regression analysis of Prehistoric Native American projectile points. The lengths of the projectiles were regressed on the width of the projectile points. 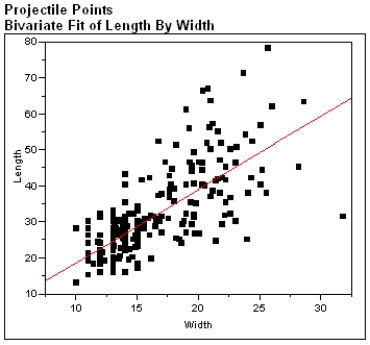
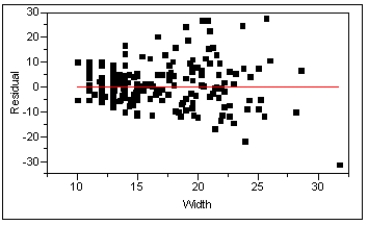 Using these plots categorize each of the Basic Assumptions of the simple linear regression model as one of the following:
a)Not checkable
b)Checked and met
c)Checked and not met
For all assumptions checked, explain what aspect of the graphs led you to your conclusion that the assumption was met or not met.
Correct Answer:

Verified
Checking the assumptions:
•The distribut...View Answer
Unlock this answer now
Get Access to more Verified Answers free of charge
Correct Answer:
Verified
•The distribut...
View Answer
Unlock this answer now
Get Access to more Verified Answers free of charge
Q1: The expected change in the value of
Q8: What are the four "Basic Assumptions" of
Q21: The estimated standard deviation, s<sub>e</sub>, has n
Q25: The estimated mean value of y is
Q35: In a random sample of large cities
Q37: If there is a negative linear relationship
Q39: The computer output given below shows a
Q41: When the four basic assumptions for a
Q42: A study was carried out to investigate
Q43: If there is no evidence of a