Multiple Choice
Which one of the following graphs shows how the inductive reactance varies with frequency? 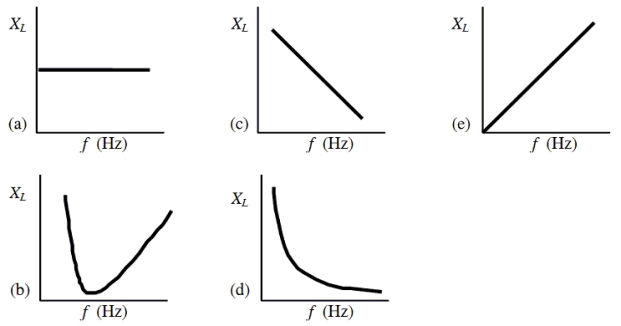
A) a
B) b
C) c
D) d
E) e
Correct Answer:

Verified
Correct Answer:
Verified
Related Questions
Q1: The graph shows the impedance as a
Q6: An ac generator supplies an rms
Q7: An ac generator supplies a peak
Q14: Note the following circuit elements: (1) resistors,
Q21: The graph shows the voltage across
Q34: An ac circuit consists of a series
Q36: An ac generator supplies a peak
Q51: In an ac circuit, a 0.055-H inductor
Q57: An ac generator supplies an rms
Q82: An ac generator supplies a peak