Multiple Choice
The graph shows the impedance as a function of frequency for a series RCL circuit.At what frequency does the capacitor make the largest contribution? 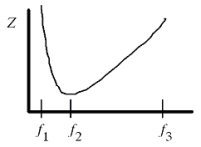
A) f1
B) f2
C) f3
D) f1 or f3
E) f1 or f2 or f3
Correct Answer:

Verified
Correct Answer:
Verified
Related Questions
Q5: Which one of the following graphs shows
Q6: An ac generator supplies an rms
Q7: An ac generator supplies a peak
Q14: Note the following circuit elements: (1) resistors,
Q21: The graph shows the voltage across
Q34: An ac circuit consists of a series
Q36: An ac generator supplies a peak
Q51: In an ac circuit, a 0.055-H inductor
Q57: An ac generator supplies an rms
Q82: An ac generator supplies a peak