Multiple Choice
The pattern of this chart shows: 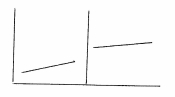
A) Change in slope
B) Drift and change in level
C) No change in level but change in slope
D) None of the above.
Correct Answer:

Verified
Correct Answer:
Verified
Related Questions
The pattern of this chart shows:
A) Change in slope
B) Drift and change in level
C) No change in level but change in slope
D) None of the above.
Correct Answer:
Verified