Multiple Choice
Figure 8-2
The vertical distance between points C and D represents a tax in the market.
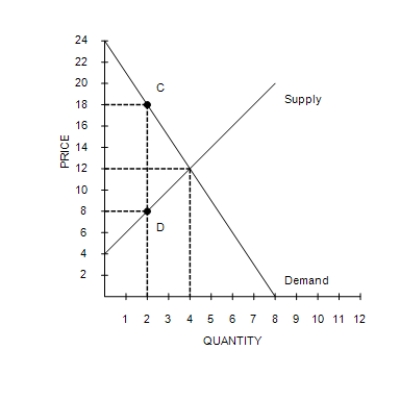
-Refer to Figure 8-2. The loss of producer surplus associated with some sellers dropping out of the market as a result of the tax is
A) $6.
B) $4.
C) $8.
D) $12.
Correct Answer:

Verified
Correct Answer:
Verified
Q89: Figure 8-9<br><br> <img src="https://d2lvgg3v3hfg70.cloudfront.net/TB7555/.jpg" alt="Figure 8-9
Q90: When a tax is imposed on buyers,
Q91: Scenario 8-3<br><br>Suppose the market demand and market
Q92: Figure 8-10<br><br> <img src="https://d2lvgg3v3hfg70.cloudfront.net/TB7555/.jpg" alt="Figure 8-10
Q93: Figure 8-9<br><br> <img src="https://d2lvgg3v3hfg70.cloudfront.net/TB7555/.jpg" alt="Figure 8-9
Q95: Figure 8-7<br>The vertical distance between points A
Q96: Figure 8-10<br><br> <img src="https://d2lvgg3v3hfg70.cloudfront.net/TB7555/.jpg" alt="Figure 8-10
Q97: If the government imposes a $3 tax
Q98: When a tax is imposed on a
Q99: Figure 8-4<br>Suppose the government imposes a $10