Multiple Choice
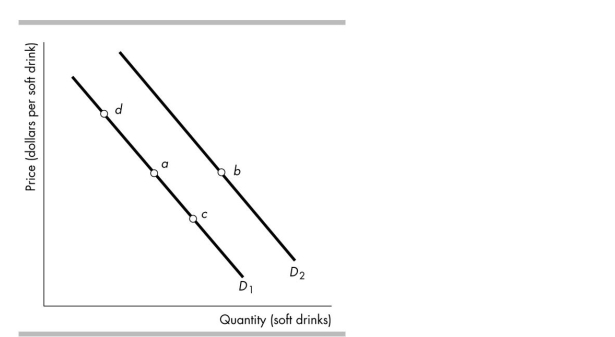
-Consider the demand curves for soft drinks shown in the figure above. Moving from point a to point c means that
A) the marginal benefit of each additional soft drink falls.
B) the price of a soft drink has increased.
C) people's incomes have decreased.
D) the opportunity cost of another soft drink increases.
Correct Answer:

Verified
Correct Answer:
Verified
Q87: A complement is a good<br>A) of lower
Q88: A market where no single buyer or
Q89: <img src="https://d2lvgg3v3hfg70.cloudfront.net/TB4952/.jpg" alt=" -The above figure
Q90: The opportunity cost of a good is
Q91: An increase in the number of fast-
Q93: When the price of a pizza decreases
Q95: If the quantity of textbooks supplied is
Q96: How many sides does a market have?<br>A)
Q100: When the price of a good is<br>A)above
Q323: A bakery can produce either cakes or