Multiple Choice
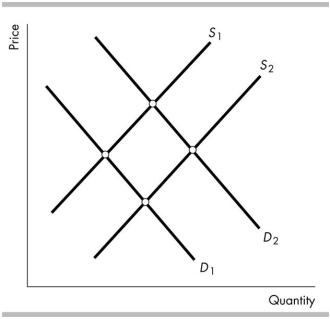
-The above figure shows the market for petrol. When a cyclone destroys a major refinery that refines oil into petrol, the
A) demand curve for petrol does not shift, and the supply curve of petrol shifts from S1 to S2.
B) demand curve for petrol does not shift, and the supply curve of petrol shifts from S2 to S1.
C) demand curve for petrol shifts from D1 to D2 and the supply curve of petrol does not shift.
D) demand curve for petrol shifts from D1 to D2 and the supply curve of petrol shifts from S2 to S1.
Correct Answer:

Verified
Correct Answer:
Verified
Q85: Students can rent a Blu- ray movie
Q86: <img src="https://d2lvgg3v3hfg70.cloudfront.net/TB4952/.jpg" alt=" -In the above
Q87: A complement is a good<br>A) of lower
Q88: A market where no single buyer or
Q90: The opportunity cost of a good is
Q91: An increase in the number of fast-
Q92: <img src="https://d2lvgg3v3hfg70.cloudfront.net/TB4952/.jpg" alt=" -Consider the demand
Q93: When the price of a pizza decreases
Q170: During the last decade, the price of
Q323: A bakery can produce either cakes or