Multiple Choice
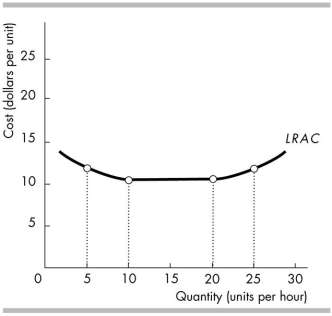
-In the above figure, the long- run average cost curve exhibits economies of scale
A) along the entire curve.
B) between 10 and 20 units per hour.
C) between 20 and 25 units per hour.
D) between 5 and 10 units per hour.
Correct Answer:

Verified
Correct Answer:
Verified
Q130: If a firm's marginal product of labour
Q131: Ernie's Earmuffs produces 200 earmuffs per year
Q132: If the wages a firm pays it
Q133: <img src="https://d2lvgg3v3hfg70.cloudfront.net/TB4952/.jpg" alt=" -The table above
Q134: <img src="https://d2lvgg3v3hfg70.cloudfront.net/TB4952/.jpg" alt=" -The table above
Q135: <img src="https://d2lvgg3v3hfg70.cloudfront.net/TB4952/.jpg" alt=" -The above figure
Q136: Most total product curves have<br>A) output first
Q137: A company could produce 100 units of
Q139: In economics, the short run is the
Q140: When long- run average cost remains constant