Multiple Choice
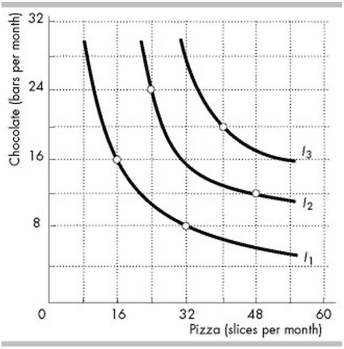
-The indifference curves in the figure above (I1, I2 and I3) reflect Peter's consumption preferences. Which of the following combinations of goods does Peter prefer the most?
A) 48 slices of pizza and 12 chocolate bars
B) 32 slices of pizza and 8 chocolate bars
C) 24 slices of pizza and 24 chocolate bars
D) 40 slices of pizza and 20 chocolate bars
Correct Answer:

Verified
Correct Answer:
Verified
Q140: Which of the following will change the
Q141: <img src="https://d2lvgg3v3hfg70.cloudfront.net/TB4952/.jpg" alt=" -Consider the change
Q142: <img src="https://d2lvgg3v3hfg70.cloudfront.net/TB4952/.jpg" alt=" -Consider the budget
Q143: The magnitude of the slope of an
Q144: <img src="https://d2lvgg3v3hfg70.cloudfront.net/TB4952/.jpg" alt=" -In the above
Q145: If Rachel is at her best affordable
Q146: Movies are $10 a ticket, and DVD
Q147: In an indifference curve/budget line diagram, a
Q148: <img src="https://d2lvgg3v3hfg70.cloudfront.net/TB4952/.jpg" alt=" -The figure above
Q149: <img src="https://d2lvgg3v3hfg70.cloudfront.net/TB4952/.jpg" alt=" -The figure above