Multiple Choice
Listed below is the net sales in $ million for Home Depot Inc., and its subsidiaries from 1994 to 2003. 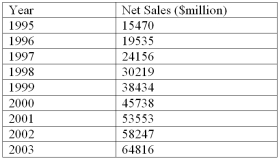 Using the printout below, what are the estimated sales for 2006?
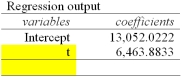
A) $90,618.6 Million
B) $477,690.9 Million
C) $84,154.7 Million
D) $103,546.4 Million
E) $71,227.0 Million
Correct Answer:

Verified
Correct Answer:
Verified
Q1: A linear trend equation is used to
Q12: i. In the linear trend equation, the
Q13: The table below shows the sales for
Q14: Economic periods of prosperity followed by recession
Q15: A plastics manufacturing performed a quarterly time
Q16: i. The ratio-to-moving-average method eliminates the seasonal,
Q18: i. The irregular component of a time
Q19: i. A typical monthly seasonal index of
Q20: i. The ratio-to-moving average method removes the
Q21: i. In the ratio-to-moving-average procedure, using the