Multiple Choice
A plastics manufacturing performed a quarterly time series analysis for demands over the last five years (periods 1 through 20) . The analysis resulted in the following trend equation and seasonal indexes:  = 920.0 + 22.6 t
 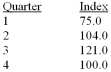 If demand for period 19 was actually 1,000, what was the deseasonalized demand?
A) 1045.95
B) 1394.60
C) 750.00
D) 1333.33
E) 1859.47
Correct Answer:

Verified
Correct Answer:
Verified
Q10: Listed below is the net sales in
Q11: Listed below is the net sales in
Q12: i. In the linear trend equation, the
Q13: The table below shows the sales for
Q14: Economic periods of prosperity followed by recession
Q16: i. The ratio-to-moving-average method eliminates the seasonal,
Q17: Listed below is the net sales in
Q18: i. The irregular component of a time
Q19: i. A typical monthly seasonal index of
Q20: i. The ratio-to-moving average method removes the