Multiple Choice
The partial megastat output below is regression analysis of the relationship between annual payroll and number of wins in a season for 28 teams in professional sports. The purpose of the analysis
Is to predict the number of wins when given an annual payroll in $millions. Although technically not a sample, the baseball data below will be treated as a convenience sample of all major league professional sports. 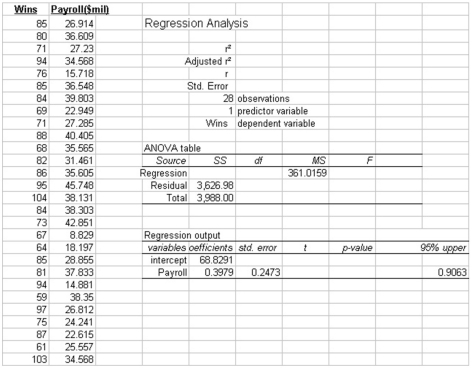
Refer to the printout above. How many independent variables?
A) 1
B) 2
C) 9
D) 10
E) 11
Correct Answer:

Verified
Correct Answer:
Verified
Q36: i. The technique used to measure the
Q108: <img src="https://d2lvgg3v3hfg70.cloudfront.net/TB7521/.jpg" alt=" -What is the
Q109: i. Correlation analysis is a group of
Q110: i. The technique used to measure the
Q111: What is the chart called when the
Q112: i. Trying to predict weekly sales with
Q114: i. The coefficient of correlation is a
Q115: The partial megastat output below is regression
Q117: The partial megastat output below is regression
Q118: Given the scatter diagram below, that shows