Multiple Choice
The partial megastat output below is regression analysis of the relationship between annual payroll and number of wins in a season for 28 teams in professional sports. The purpose of the analysis
Is to predict the number of wins when given an annual payroll in $millions. Although technically not a sample, the baseball data below will be treated as a convenience sample of all major league professional sports. 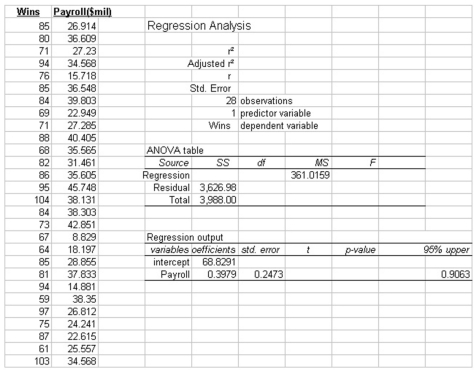 Refer to the printout above. The critical value of t, at the 5% level of significance, for testing the coefficient of correlation is:
A) 2.201
B) 1.833
C) 2.228
D) 3.717
E) 2.262
Correct Answer:

Verified
Correct Answer:
Verified
Q31: If the correlation between two variables is
Q36: i. The technique used to measure the
Q43: i. If the coefficient of correlation is
Q67: A regression analysis yields the following information:<br>Y'
Q112: i. Trying to predict weekly sales with
Q113: The partial megastat output below is regression
Q114: i. The coefficient of correlation is a
Q115: The partial megastat output below is regression
Q118: Given the scatter diagram below, that shows
Q122: i. A t test is used