Multiple Choice
A random sample of 30 executives from companies with assets over $1 million was selected and asked for their annual income and level of education. The ANOVA comparing the average income among three levels of education rejected the null hypothesis. The Mean Square Error (MSE) was
243.7.
The following table summarized the results: 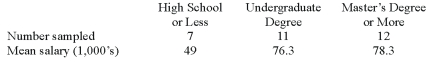
When comparing the mean salaries to test for differences between treatment means, the t statistic is based on:
A) The treatment degrees of freedom.
B) The total degrees of freedom.
C) The error degrees of freedom
D) The ratio of treatment and error degrees of freedom
Correct Answer:

Verified
Correct Answer:
Verified
Q8: Which of the following is NOT a
Q12: A random sample of 30 executives from
Q13: In ANOVA analysis, when the null hypothesis
Q14: A manufacturer of automobile transmissions uses three
Q17: Given the following Analysis of Variance table
Q18: The components of an ANOVA table include:<br>A)
Q19: A manufacturer of automobile transmissions uses three
Q20: A manufacturer of automobile transmissions uses three
Q21: Two accounting professors decided to compare the
Q60: An F-statistic is _.<br>A)a ratio of two