Multiple Choice
A random sample of 30 executives from companies with assets over $1 million was selected and asked for their annual income and level of education. The ANOVA comparing the average income among three levels of education rejected the null hypothesis. The Mean Square Error (MSE) was 243.7. The following table summarized the results: 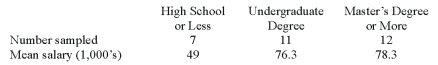 When comparing the mean annual incomes for executives with Undergraduate and Master's Degree or more, the following 95% confidence interval can be constructed:
A) 2.0 ± 2.052*6.51
B) 2.0 ± 3.182*6.51
C) 2.0 ± 2.052*42.46
D) None of these statements are true
Correct Answer:

Verified
Correct Answer:
Verified
Q7: Suppose that an automobile manufacturer designed a
Q8: i. For the population means, the alternate
Q8: Which of the following is NOT a
Q9: i. The F distribution is positively skewed
Q10: i. The shape of the F distribution
Q13: In ANOVA analysis, when the null hypothesis
Q14: A manufacturer of automobile transmissions uses three
Q16: A random sample of 30 executives from
Q17: Given the following Analysis of Variance table
Q60: An F-statistic is _.<br>A)a ratio of two