Multiple Choice
Using the frequency table below, determine the relative frequencies for Apartment and Townhouse listings. 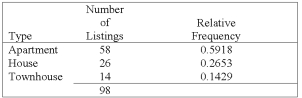
A) .5,000 and .5,000
B) .5,000 and .2,653
C) .2,653 and .1,429
D) .1,429 and .2,495
E) .5,918 and .1,429
Correct Answer:

Verified
Correct Answer:
Verified
Related Questions
Q10: (i) Bar charts are useful for showing
Q11: Refer to the following ages (rounded to
Q12: Refer to the following ages (rounded to
Q13: The grades on a statistics exam for
Q17: A table showing the number of observations
Q18: Refer to the following chart showing a
Q20: (i) Pie charts are useful for showing
Q31: When data is collected using a qualitative,nominal
Q68: The relative frequency for a class is
Q87: How many employees were absent between 3